|
|
A Gallery of Citric Acid Photomicrographs (using
a variety of illumination techniques) |
|
|
A Gallery of Citric Acid Photomicrographs (using
a variety of illumination techniques) |
Citric acid is a weak organic acid found
in citrus fruits and some vegetables. Lemons contain the highest
percentage of the chemical about 8% by mass. Its naturally sour
taste results in its being added to many soft-drinks as a
flavouring. In addition, it acts as a natural preservative in
many food items.
Citric acid was first isolated from
lemon juice in 1784 by the Swedish chemist Carl Wilhelm Scheele.
In 1893, C. Wehmer found that the penicillium mold could be used to
produce citric acid from sugar. Since fruit was readily
available, this type of biological or microbial synthesis seemed
unnecessary. However, when the first world war disrupted Italian
citrus imports, microbial synthesis of the compound became industrially
important.
2
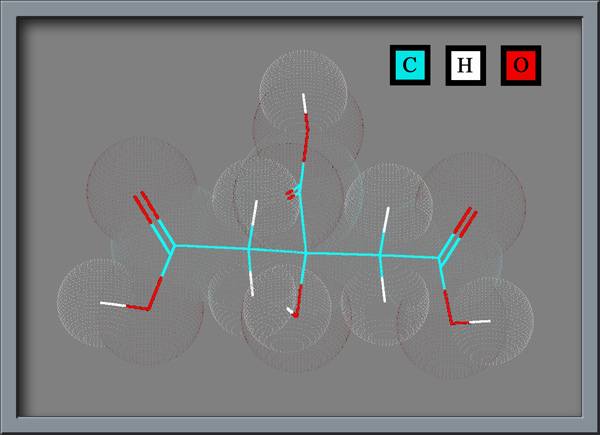
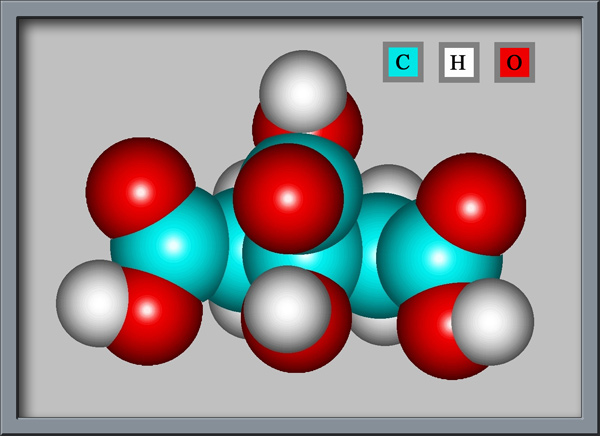
Hydroxy 1, 2, 3 propanetricarboxylic acid, or citric acid, whichever you prefer,
contains three carboxylic acid groups (-COOH), as can be seen
below. (Both illustrations were produced using HyperChem Pro software.) Each
of these groups can lose a proton in solution, resulting in a citrate
ion. These citrate
ions are used to
make buffers that control the acidity (pH) of pharmaceutical and food
products.
For this article, a specimen was
prepared by placing a small quantity of the pure white crystalline
solid on a microscope slide, covering with a cover-glass, and heating
gently with an alcohol lamp until the crystals melt. (Melting
temperature is 100 degrees Celsius.) Melt specimens usually
re-crystallize almost immediately after cooling. This is not the
case with citric acid. The images in the article were taken after
about 90% of the melt had solidified, five
weeks, after the slides had been removed from the heat of the
flame! Patience is a virtue when dealing with this
compound! (Special care must be taken not to overheat the sample
while melting. If this occurs, decomposition of the citric acid
produces unsightly bubbles in the finished slide.)
Note:
The MSDS safety document for the compound states the following:
WARNING!
CAUSES SEVERE EYE IRRITATION. CAUSES IRRITATION TO SKIN AND RESPIRATORY
TRACT.
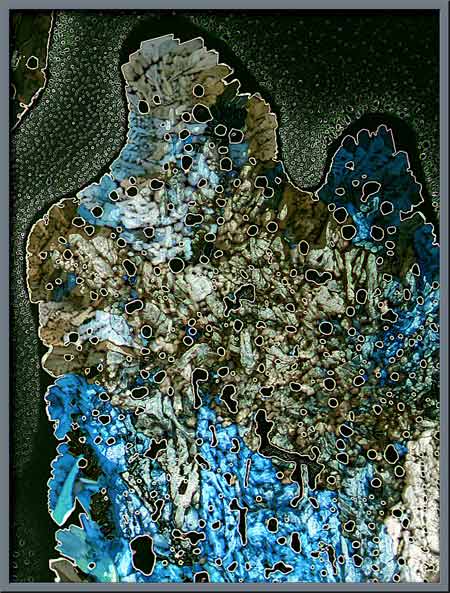
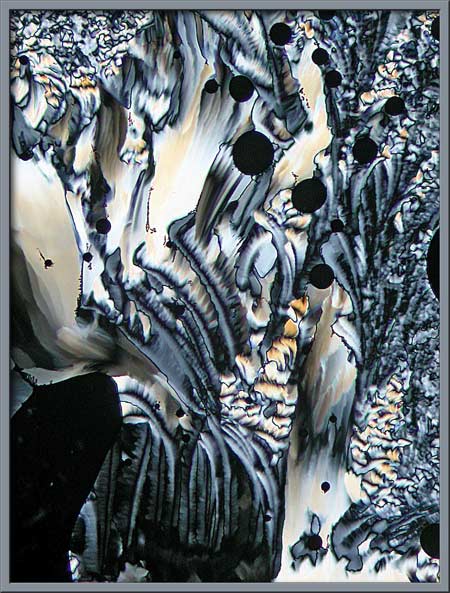
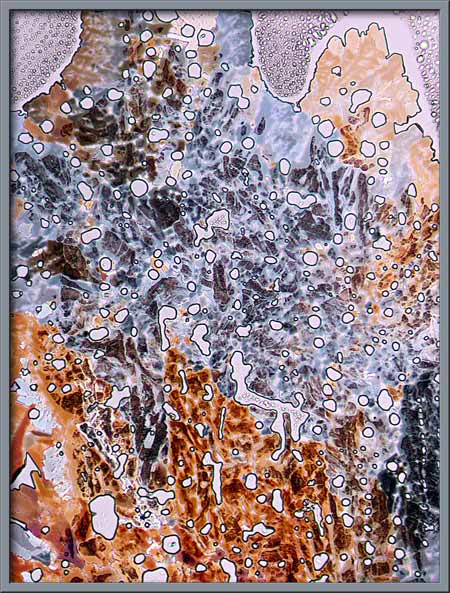
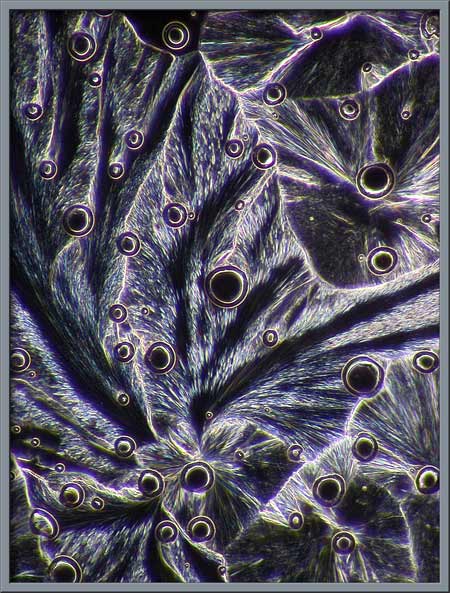
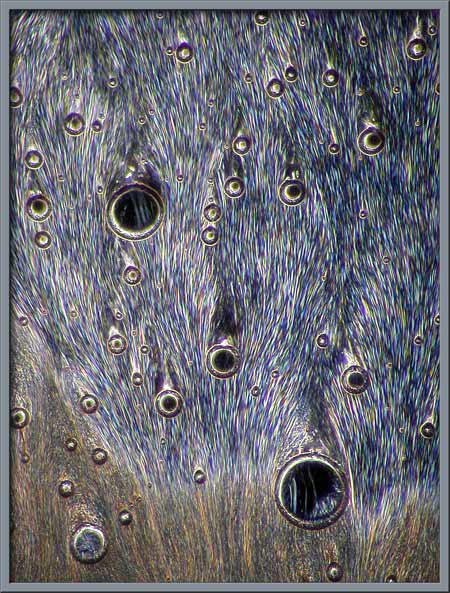
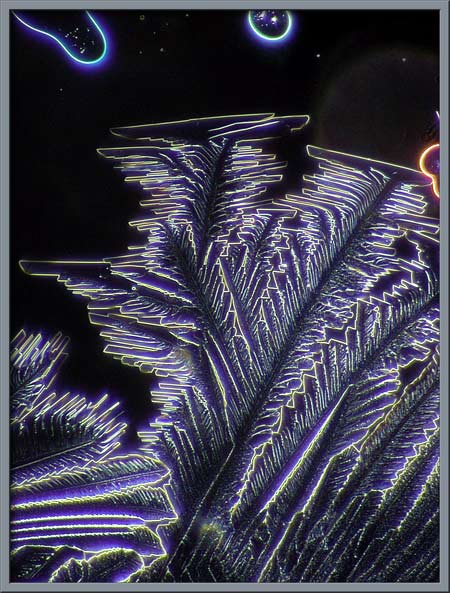
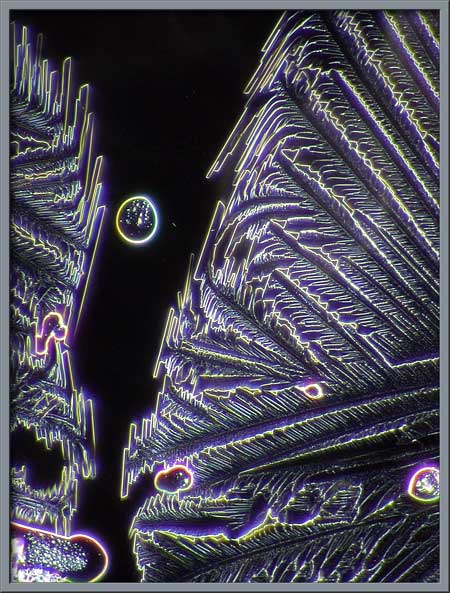
The following three images show
typical fields between crossed polars. The black circles are
gas-filled bubbles that formed as decomposition occurred during the
melting process. Magnification has increased with each
photomicrograph.
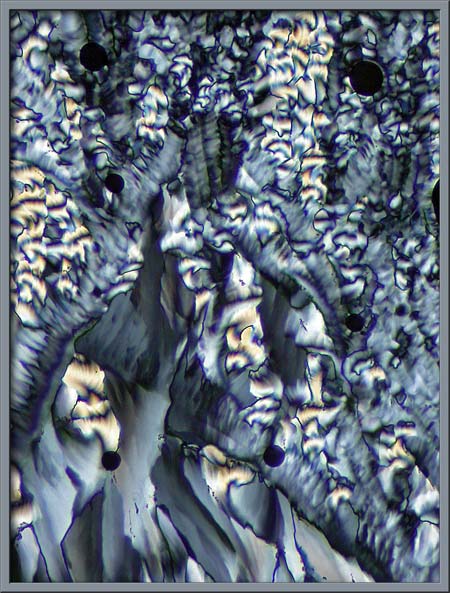
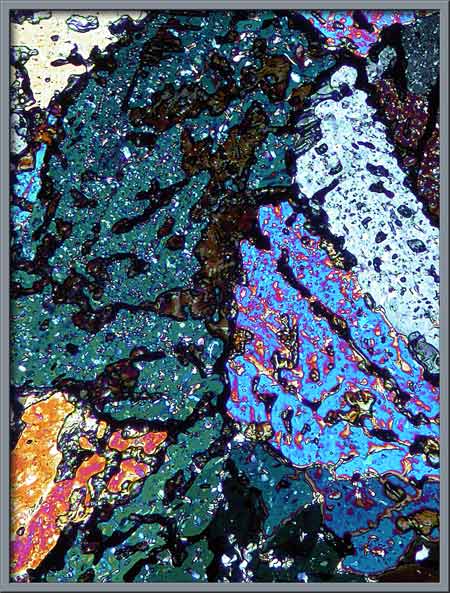
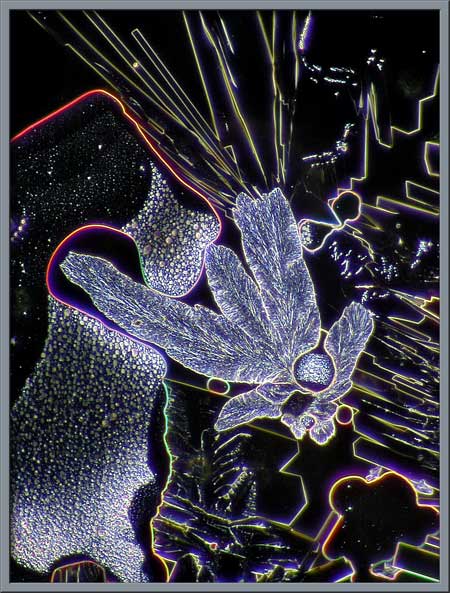
By using elliptically polarized
light, (obtained by the use of two lambda/4 compensators), the
background is coloured off-white instead of the normal black.
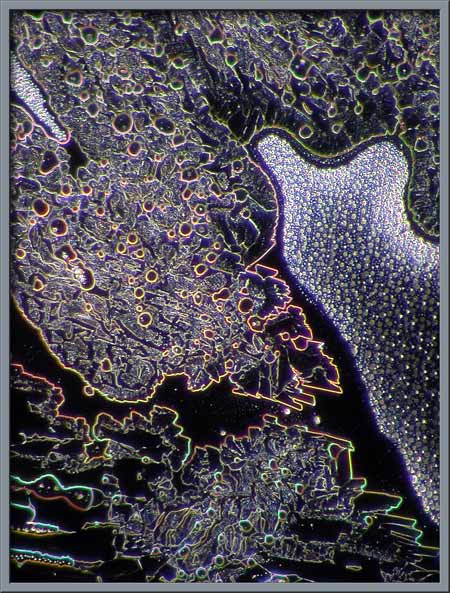
Three images of the same field,
with increasing magnification, again using elliptically polarized
light, are shown below. The irregularly shaped gaps are voids
formed by overheating during the melting process. Note that the
first image in the article is identical to the first image below.
Photoshop CS was used to invert the colours of the earlier image.
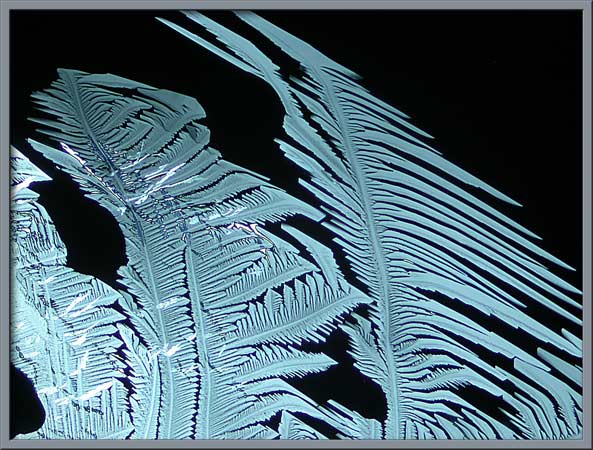
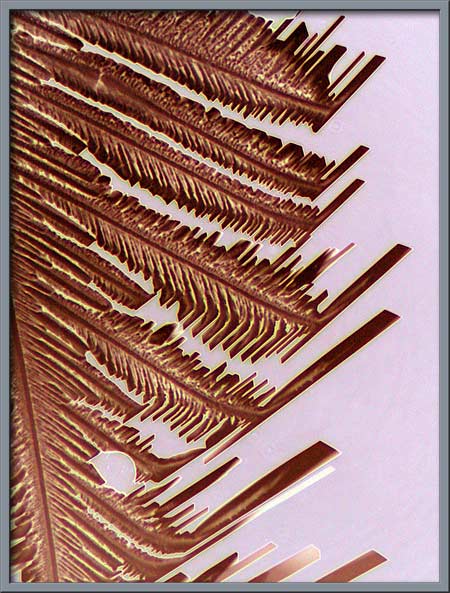
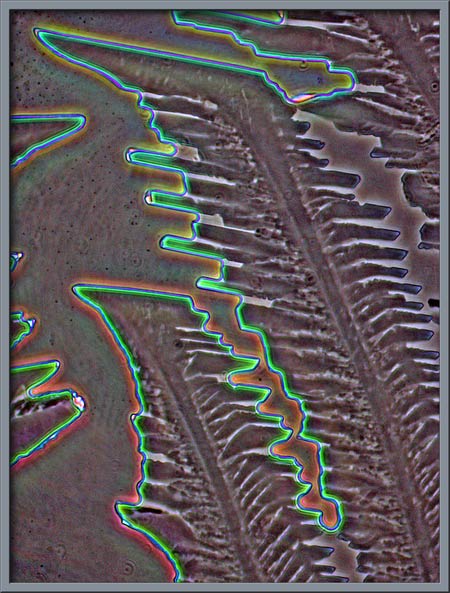
Several finger-shaped crystal
structures on the slide are shown below. (Elliptically polarized light)
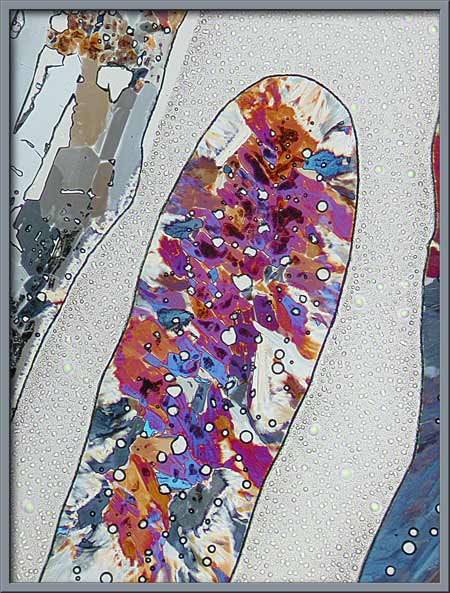
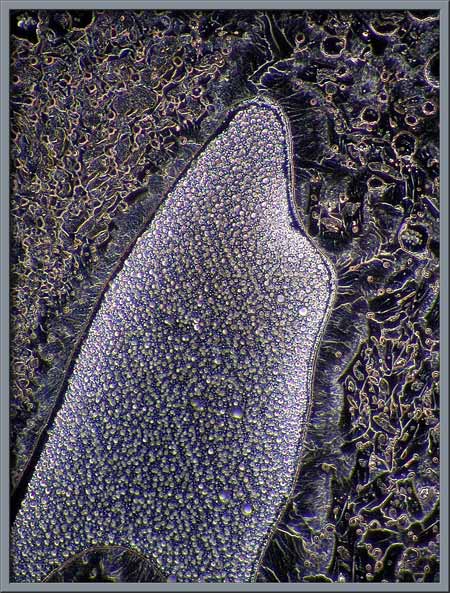
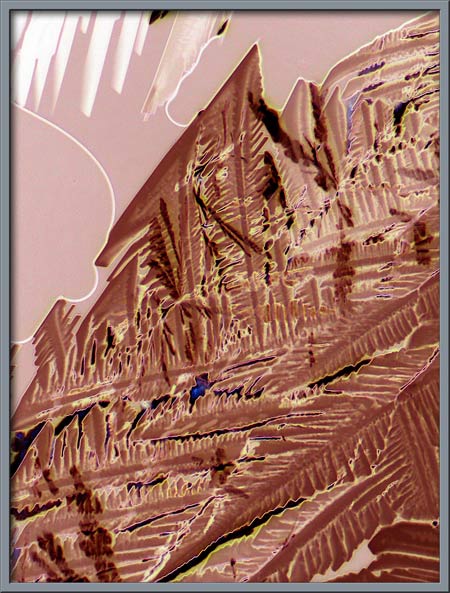
It is difficult to maintain a
constant distance between slide and cover-glass while making a melt
specimen. Very different crystal thicknesss sometimes
occur. The following image shows a particularly thick area of
crystal growth on the slide. (Plane polarized light)
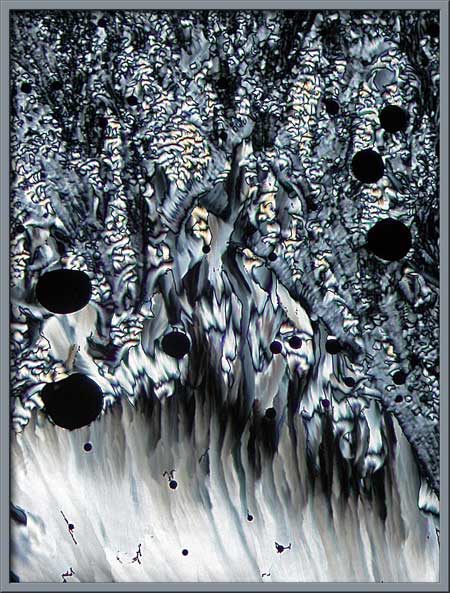
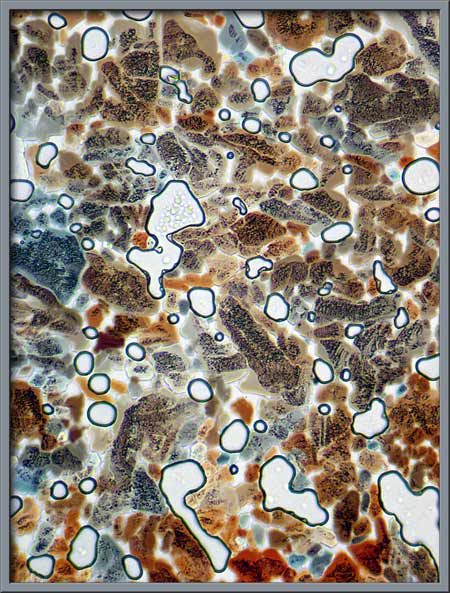
By replacing the polarizing
condenser with a dark-ground condenser, it is possible to display the
circular decomposition voids more vividly.
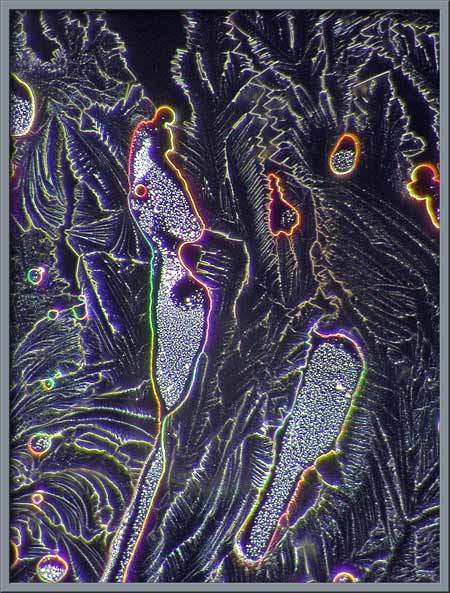
If a phase-contrast condenser is
used with a normal, (non-phase) objective, a different sort of
dark-ground image is formed which is highlighted by coloured
interference patterns. Four examples are shown below.
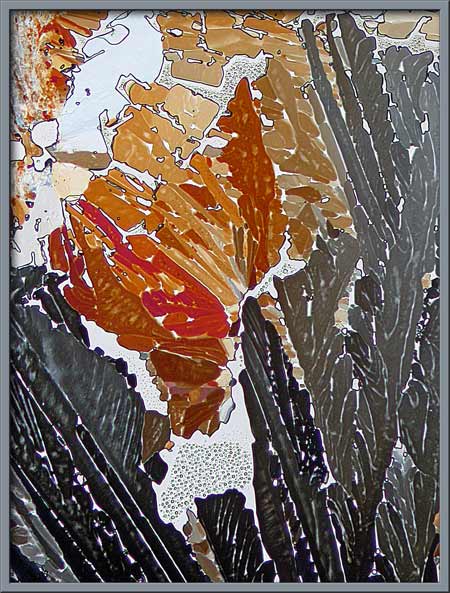
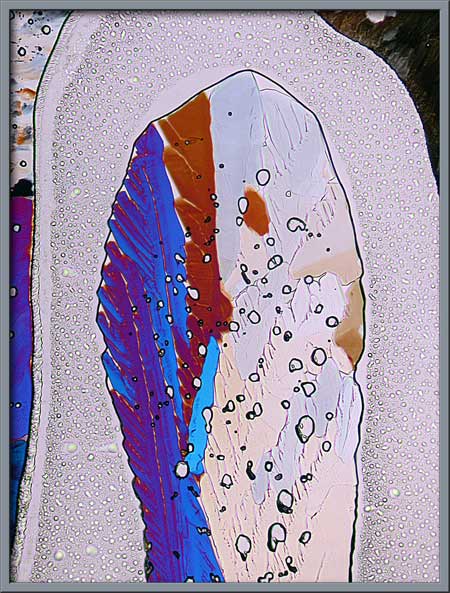
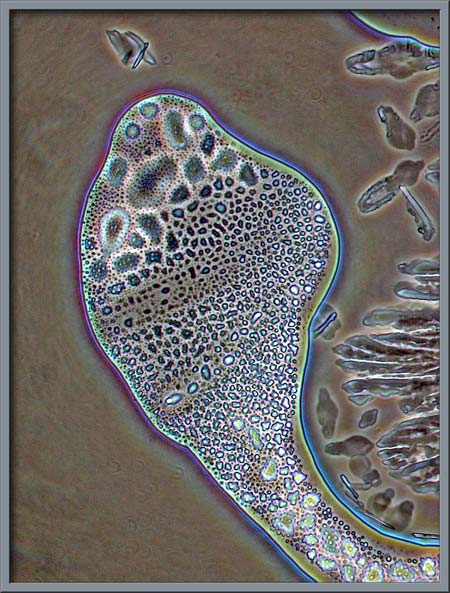
Several
melt specimens displayed the strange crystal structures that can be
seen below. (Plane-polarized light.)
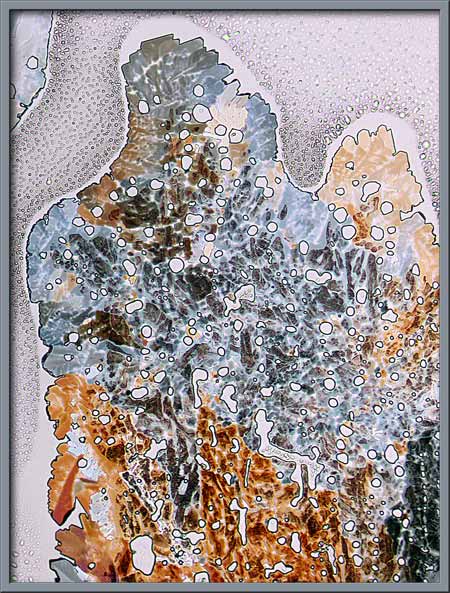
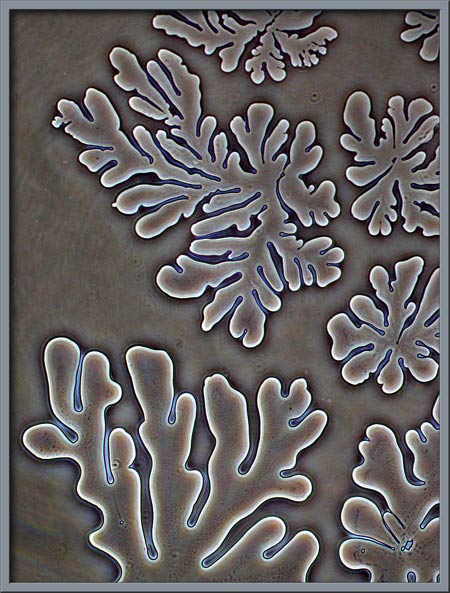
By using a phase-contrast condenser
with non-phase objective, the structures are revealed in a different
light.
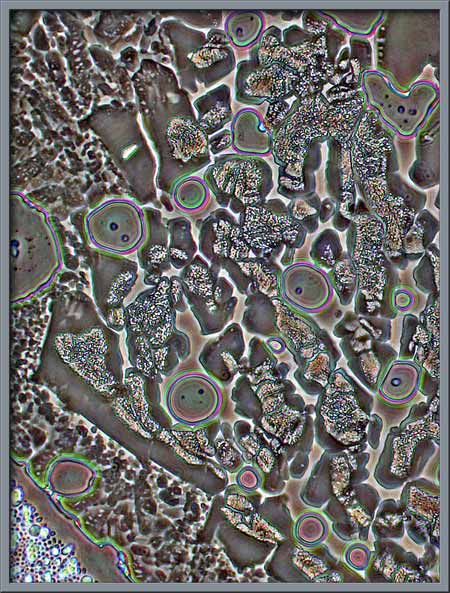
Similar structures, taken with
elliptically polarized light, and transformed within Photoshop using
the Invert (colour) command, can be seen below.
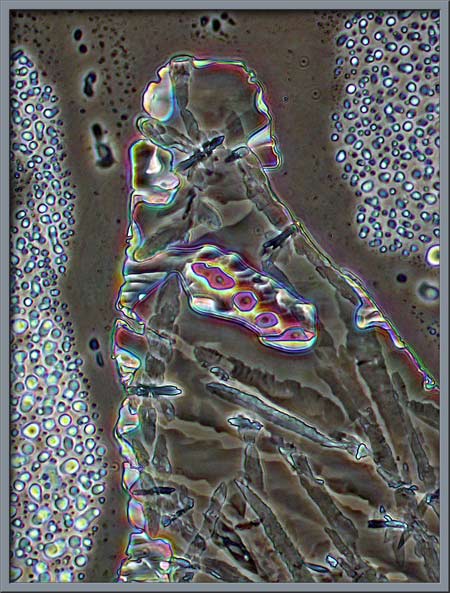
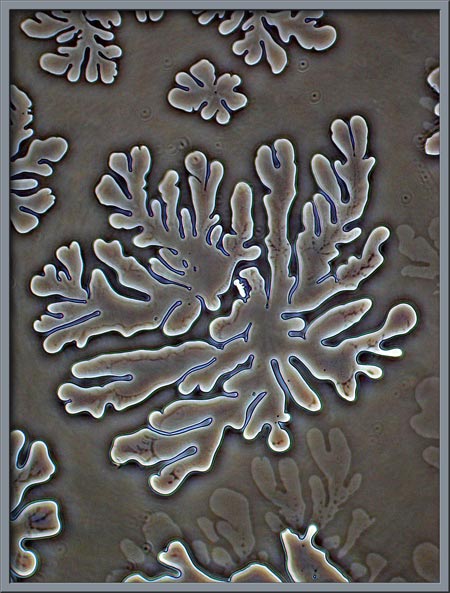
Proper phase-contrast illumination,
(phase-contrast condenser and phase objective), gives another view of
the structures.
Again, normal phase-contrast
illumination was used to show the following interesting fields.
Fractal-like
patterns occurred regularly near the edge of the cover-glass.
They were likely formed by the Permount, and had nothing to do with the
citric acid structures. (Phase-contrast)
Its
unlikely that we could go a single day without eating or drinking
something containing citric acid or citrate ions. I hope that
this article has given you a different perspective on this common
organic compound.
Photomicrographic
Equipment
The images in the article were
photographed using a Nikon Coolpix 4500 camera attached to a Leitz
SM-Pol polarizing microscope. Images were produced using several
illumination techniques: dark-ground, phase contrast and polarized
light. Crossed polars were used in all polarized light
images. Compensators, ( lambda and lambda/4 plates ), were
utilized to alter the appearance in some cases. A 2.5x, 6.3x, 16x
or 25x flat-field objective formed the original image and a 10x
Periplan eyepiece projected the image to the camera lens.
Published in the July
2007 edition of Micscape.
Please report any Web problems or
offer general comments to the Micscape
Editor.
Micscape is the on-line monthly magazine
of the Microscopy UK web
site at Microscopy-UK
© Onview.net Ltd, Microscopy-UK, and all contributors 1995 onwards. All rights reserved. Main site is at www.microscopy-uk.org.uk with full mirror at www.microscopy-uk.net .