Birefringent Organic Crystals
Butterflies on Glass
by Ray Dessy, Blacksburg, VA USA
ABSTRACT
Art, Technology, and Myths: This article was inspired by the many exquisite contributions to MicScape containing photomicrographs of crystals taken via crossed-polarizers. Having pursued fiber-optic lab research for 50 years, and with an interest in plant pigments and their interesting physics, it was a challenge to understand the vocabulary of crystallographers and petrography. The multiple-colored mosaics and the maths notation often proved immiscible and daunting. Why so many colors?; why so many patterns?; why such difficulty in repeating results? But reaching back to my halcyon years of organic synthesis and crystallization, recalling vivid memories of scratching the sides of Erlenmeyer flasks with a glass rod to induce crystallization; the possible myths that “old” labs gave better, quicker nucleation of crystals because of “seed-crystals” in the air; and that the German organic chemistry wizards of the 19th Century often fluffed their voluminous beards to scatter “dandruff or crystal debris” into beakers to arouse the crystal genii— it seemed appropriate to try to bring all the areas together in a single document.
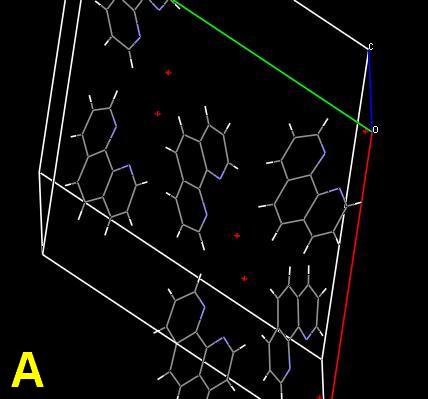
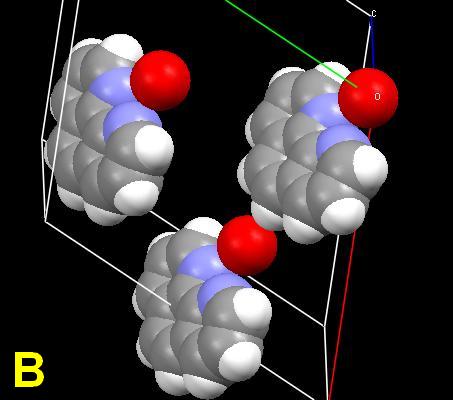
As a challenge, the planar compound 1,10-phenanthroline monohydrate was chosen for study. Its crystal structure is known. The single crystal is simple, with the organic molecules connected through intramolecular hydrogen (N…HOH) bonds between the nitrogen atoms and the water molecules. Ball-stick and space-filling unit cells are shown. 1(Cells A, B) The red spheres represent the water molecules. The structure can be regarded as a screw supermolecule assembled by hydrogen bonds. Microphotographs will be shown demonstrating the effect of scratches, and crystallization from different solvents, including anhydrous alcoholic hydrochloric acid. But first—why all the colors? The response is obviously “light interference”, but my mind was then clouded by a vagueness of memory and overly complex on-line and cellulose sources.
____________________
The Newton colors that make up
the palette employed to paint the micro-photos derive from the
symmetry of crystals having an optical anisotropy, with
different characteristics and shapes in different directions,
allowing them to possess different refractive indices in
different directions. This is in contrast to cubic crystalline
systems which are isotropic, and offer only one refractive
index to transmitted light regardless of direction. A
qualitative and semi-quantitative explanation of the
interference colors observed in birefringent crystals
sandwiched between crossed polarizers is not complicated, just
a bit convoluted, and there is enjoyment in piecing together
the principles that gives our eyes such pleasure. The goal is
to encourage crystal painters to use multiple color and
geometric palettes through an understanding of morphology,
chemistry and physics.
The story has three sections, all interdependent, but presented sequentially to make the various contributors to the colorful displays simpler to visualize.
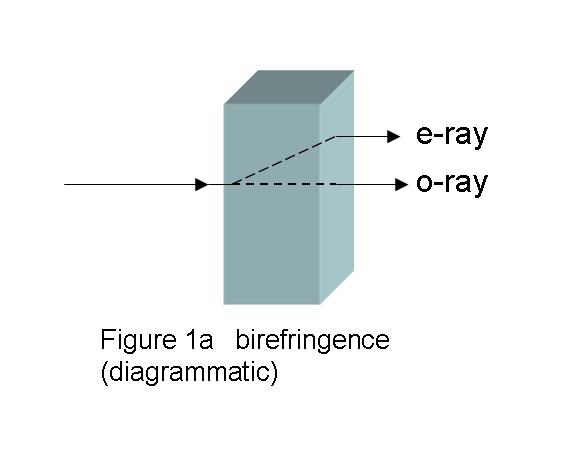
Birefringency:
Anistotropic birefringent crystals can split the entering
planar polarized light beam into two beams, as shown in
Fig. 1a, which shows a specifically cut
birefringent material with the light entering in one certain
direction. One emerging beam is undeviated in direction, but
has been slowed during its passage by the thickness of the
crystal, d, and the refractive index, no, of the
birefringent material in that particular direction. This beam
is called the ordinary beam, and the subscript “o”
marks that fact. The measure of “slowing” is the product of d
and no, d×no. The other beam is
refracted, and is slowed by the crystal thickness and the
refractive index, ne, of the birefringent material
in this new direction, and is termed the extraordinary
beam. The extent of this slowing is d×ne, the
subscript “e”marking this beam. As the beams traverse the
crystal the different colors of light retain their own
frequency, f, but the propagation speed of the light-waves is
reduced proportionally to the increase in the refractive index
of the material, and therefore the wave-lengths of the two
light beams change— (λ=speed/f). The waves can be represented
as sinusoidal in nature, and as the two beams re-emerge into
air one will have lagged behind the other, or been retarded.
The peaks and troughs of the two waves will no longer
necessarily be in synchrony or in-phase. If one could start a
very short pulse of light through the crystal, as the slowest
beam exits, the fastest beam will have already traveled
further and through a different refractive index environment.
A path-difference has appeared. The relative retardation or
path-difference traveled between them can be expressed as
d(no- ne), noted as R. The value
(no- ne) is called the
birefringence.
(see endnote #2 for more details, but they are not necessary for what follows; interactive links d-g below can help) 2
Since the refractive indices are dimensionless ratios, and d is a thickness, the units of R is length, usually expressed in nanometers, nm. The (no- ne) difference ranges from 0 to ~0.1-0.2. The sample thickness is usually expressed in fractions of a mm, and may be 0 to ~50 u (0.050 mm). R values can thus range from 0 to ~2500 nm, which is significant compared to the visible spectrum that runs from wave-lengths of ~400-800 nm. The refractive indices (RIs) for the various light frequencies usually change only very slightly over the range of visible white light, a phenomenon called dispersion. The change from violet to red in crown glass is ~0.01 RI. This factor can usually be ignored. BUT the loss in phase for different colors will be different because the wave-lengths of pairs during passage through the birefringent crystal are usually quite different.
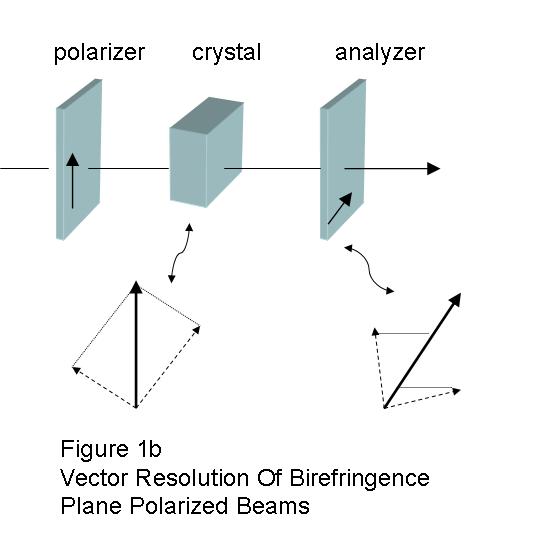
The polarizer at the exit side is termed the analyzer, and it usually has its polarization axis crossed (90o) to the entrance filter. When they are crossed, the ordinary and extraordinary exiting beams will be recombined by vector addition. (Fig. 1b) Visualizing what happens is a bit complicated, and may seem unintuitive, because when the plane polarized beam entered the crystal it was split into ordinary and extraordinary beams that are both polarized, but at right angles with respect to each other. The different wave-length pairs are affected differently. Some will reach the analyzer in-phase and are cancelled, and others reach the analyzer out-of-phase and are transmitted (sic).2, and g The eye sees light from which colors have been added or removed by interference. (Fig. 2)2, 3
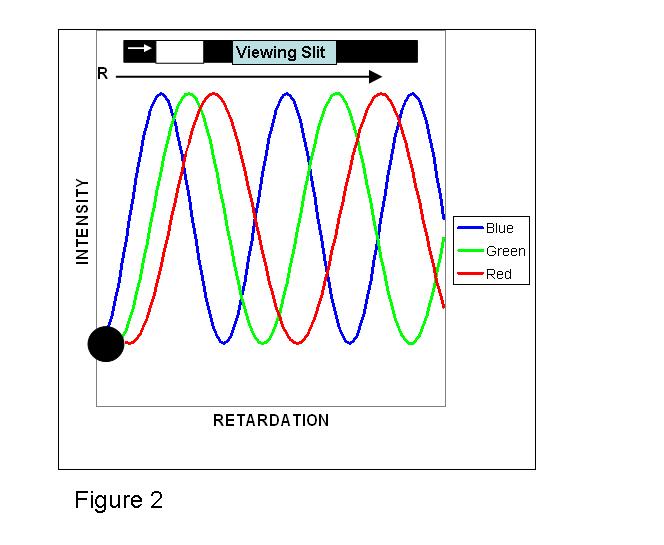
Let us first deal with the case where, using another specially cut quartz crystal, the two beam cores are coaxial and their oscillating beam planes are at a 45˚ angle to the crossed polarizers. If the crystal has a very small retardation, R, say less than ~50 nm, the recombined beams at all wave-lengths are ~ in-phase and destructively interfere, and the image at the eye-piece or film plane will be black. As the retardation d(no- ne) increases, a simple illustration using just the three primary additive colors is useful in visualizing the color palette that would evolve. One might expect to see overlapping equal intensity curves of the spectral colors of “Blue”, “Green” and “Red”, assuming no internal crystal absorption (dichroism). With linear birefringent samples the envelopes all start at the zero origin2 (recall that here the retardation is 0 and both beams at all wave-lengths are in-phase). However, the envelopes have different widths at half-height because the “Blue” end of the spectrum has shorter wave-lengths than “Green” or “Red”. Using a hypothetical moving "viewing slit", as the retardation increases, first a blue-grey color would be perceived. Given a true “white-light” source, as R increases further all three BGR curves will reach a point of about equal intensity leading to the perception of “White”, followed by a point where “Green” and “Red” are of ~ equal intensity. However, because the eye is more sensitive to “Green”, there is a perception of “Yellow”. At higher retardation only the “Red” envelope remains. The three sinusoidal-like2,3 envelopes repeat themselves with an increasing separation because of their different wave-lengths. Beyond ~575 nm the viewer perceives “Violet/Blue”, then “Blue”, at the beginning of the second order sequence. The name derives from the fact that the overlapping, but slightly displaced family of curves is beginning a second repetition. These colors are followed by a “Green” at ~ 750 nm retardation (a combination of “Blue” with “Green/Yellow”), and then almost a repeat of the first order colors sequence. Third order colors are similar to the second order sequence. Higher order sequences become more pastel in flavor. Thus increases in either the samples physical thickness or birefringence value can be active in achieving the observed color changes.
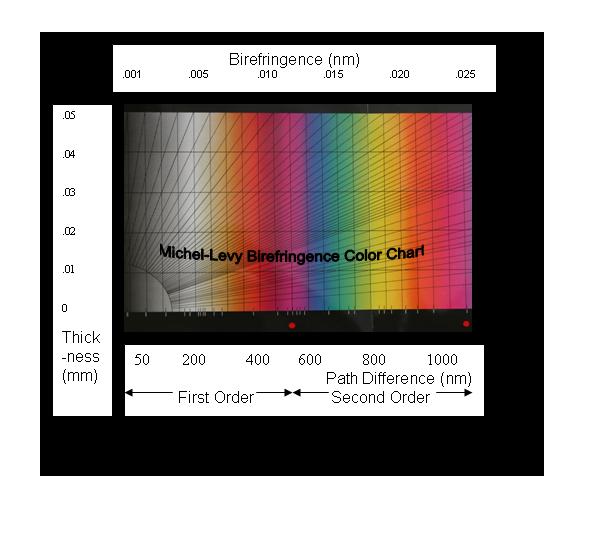
The
classical Michel-Levy Birefringence Chart is also
shown. It plots sample thickness, (d), versus retardation, or
path-difference or wave-length, all equivalent. Thus, the
bottom abscissa of different author's ML Birefringence Charts
are labeled variously, “retardation”, “path-difference”, or
“wave-length”. View it as representing colors. Straight
diagonal-lines, beginning at the origin represent increasing
birefringence values (no- ne). They
terminate at printed (no- ne) values
along the upper abscissa line and along the right ordinate
demarcation to minimize the format. Conceptually, knowing two
of the variables would yield the third. Petrographers use the
technique to identify mineral specimens.
2. The Light is in the Details: Well-formed, slowly-grown single crystals have superb symmetry, and corresponding geometric axes that help define that symmetry, like the axis of a cylinder. We are at the point where the term “specially cut crystal” can be defined. You can cut a wood dowel vertically, producing two half-cylinders, or you could cut it horizontally producing two shorter cylinders. Imagine how you might cut a 2”x4”x8” slab. In crystals, at least one special major axis, c, is usually referred to as the optical axis. If there is just one such axis, the crystal is called uniaxial. (Biaxial crystals have two such axes.) If a light beam is passed down parallel to the optical axis of a uniaxial birefringent crystal only a single beam exits, only one refractive index can be measured, no, and only a single, unchanged-polarization beam is propagated in the crystal. If placed between crossed-polarizers, it will appear grey to black. If the incident beam impacts perpendicular to the uniaxial optical axis only a single beam exits, and only a single beam is seemingly propagated in the crystal. The ordinary (o) and extraordinary (e) beams mentioned above coincide in trajectory during their journey, BUT they are shifted in phase because of their experience with the two different refractive indices, no and ne. The ordinary ray vibrates perpendicular to the optic axis; the extraordinary ray vibrates parallel to the optic axis. The crystal would show strong intensity interference colors as the retardation increases. At any other changing entrance angle, double refraction is clearly visible, an ne is measurable, and can vary between nemax/min and no. nemax/min implies ne ‘s range may be < or > no. And the color values also shifts since, even for a fixed d, (no- ne) is changing because of ne's variance. The exit beams can diverge, and under some conditions anomalous colors are seen.
3. Microcrystals: However, in most of the specimens that Micscape photos present, large single crystals are not involved. A chemist might call them “microcrystalline”, a pejorative term. The crystals are small, irregular, often fused, strained by the rapidity of their growth, and may contain various voids or spaces often occupied by solvent(s) molecules. Given the relative rapidity with which they are formed, various areas present different path thicknesses and alternative crystal orientations and therefore different entrance angles with respect to the optical axis. There is often a granular structure where neighboring crystal domains have collided, deformed, reformed, or merged. The “scratch and dig” glass surface defects provide high-energy sites for preferential nucleation and growth, as do small particles of undissolved solute or foreign matter.
Experimental Difficulties: The chemical bonding
between elements in the molecules that make up a crystal
occurs in energy-ranges that are 10 to nearly 1000 times those
involved in crystal molecular recognition and
hydrogen-bonding. Deformation, defects, non-repetitive
domains, and grain growth result. Exact observation of crystal
nucleation of organic molecules within a solution is at
present a difficult or essentially inaccessible phenomenon.
The crystal nuclei are too small to be seen by direct or
scattered light and their size distribution and dynamic growth
properties cannot usually be determined experimentally.
Computer “experiments” are the best approach to probe this
elusive reality.
Problems of unknown potentials (polarizability) and of time scale make even a computational “experiment” a very awkward one. Several experimental techniques are becoming available for the in situ monitoring of crystal growth at a molecular level; among others, atomic force microscopy. But there are only fractions of a second to observe the attachment of a single molecule. The process involves a variable time lag due to diffusional barriers within the solution. Attachment and detachment events within the solvent/solute layer in contact with the forming crystal may occur rapidly. Pre-organization steps occur in the boundary layer of growing even a simple urea crystal. Binary solute solutions are even more complicated. 4 Many crystal structures are possible even for a single molecule.
Polymorphism: The phenomenon of polymorphism (more
than one crystal structure for a given compound) was
recognized around 1825, but relatively little effort was
devoted to investigation of polymorphic forms of organic
materials until 1975. The extent of the phenomenon is evident
in the fact that over 3000 of the entries in the Cambridge
Structural Database (CSD) contain qualifying descriptors
identify them as being members of polymorphic systems.
Walter McCrone is quoted as saying “Virtually all compounds are polymorphic and the number of polymorphs of a material depends on the amount of time and money spent in research on that compound”. It is still not possible to predict with any reasonable level of confidence the macro/microscopic crystal structure of an organic material. Reports exist of “metastable” crystal forms disappearing, and often some labs report the inability to produce certain polymorphs due to some mysterious “poisoning”. 5 Time-lapse photographs often show two different polymorphs of the same compound slowly growing toward each other. When they touch, one rapidly diminishes as it is absorbed into the mass and shape of the other. 6 Patent squabbles have existed over the ownership and therapeutic benefits of polymorphs of common prescription compounds such as Zantac and Paxil, plus at least one OTC pain-reliever. Occasionally crystalline structures can “twin”, where the crystal lattices of two domains superimpose in one or more dimensions. Saccharin often exhibits this phenomenon.
Solvents: In the often used acetone/alcohols/water
solvent mixtures, at low water concentrations most of the
water is hydrogen-bonded (e.g.,
CH3)2C=O…H2O). At medium
concentrations the system may have a micro-emulsion structure
and contain sections of pure water The growth rate of
particular faces of the crystal are determined by the solvent
composition, and the defects in the crystals are distributed
sectorially depending upon the solvent composition. Growth
models of crystals usually focus on two types of faceted
planar face growth. One involves a 2D nucleus initiating a new
planar layer. The other focuses on a dislocation which creates
a screw spiral growth forming a new layer upon each rotational
growth cycle.
7
“Inclusion of solvent in the growing crystal lattice is common. In some cases the solvent may be gradually removed by heating or time without altering the crystal structure. In other cases it appears that the solvent molecules play an intimate role in the formation and stabilization of the crystal structure. Voids in crystals studied by X-Ray crystallography often contain solvent molecules”. 8 Many organic crystals are unsolvated, but one examination using the Cambridge Structural Database (CSD, version 5.15, April 1998, p 181, 309 entries) organic structures containing solvent of crystallization were retrieved and 20 common solvents found to occur at least 50 times.
“Water is incorporated into organic crystals far more frequently than other common solvents. Of the 69,691 entries in the 1988 (3.1) version of the CSD, of the 33,886 compounds not containing a metal atom, 3696 are solvated. When these 'pure' organics are surveyed, the number of entries having water of crystallization is far in excess of the number having other solvents. The following statistics were obtained: water (2566); methanol (306); diethyl ether (175); benzene (173); ethanol (168); acetone (108); chloroform (102); others (98). These figures are striking because water is not a particularly good solvent for organic compounds and because of the comparable frequencies with which any other of the above common solvents were used for crystallization.” 9
“Co-crystallization” of two different solutes is also common, with profound effects as the accompanying photographs will show. Mixed solvent systems are also commonly used. The results are often spectacular, but unpredictable.
Conclusion- Complicated Crystal Colors:
The colors we see with crossed polarizers arise because of interacting physics and chemistry. ALL of the above factors affecting orientation geometry, refractive index, thickness, chemical composition, strain, polymorphism and co-crystallization create vivid colors from a transparent canvas. It is not really necessary to understand how the colors arise, but an exposure to their various sources of creation lends an increased sense of appreciation for their beauty in our eye, and suggestions in our mind as how to create better art.
Experiments and Photographs: The samples shown in the photographs that accompany this explanation were prepared by dissolving the organic solids in various ethanol/isopropanol/acetone/water mixtures and placing drops of the solution on standard slides. The solvents evaporated, leaving thin films of crystals. Fast evaporating solvents were chosen to increase the microcrystalline structure, polymorphism, and stress factors. The microscope was an Olympus trinocular scope equipped with a Nikon 5700 digital camera and a Martin Microscope multi-element afocal extension tube mated to the third port. A rotating plane polarizer was mounted between the illumination lens and the Abbe condenser, and a fixed-position plane polarizer was located in a conjugate position above the objective turret. The high camera position made direct LCD monitor or LCD viewfinder focusing difficult. A small hand-held size LCD/TV viewer connected to the camera’s output port made it easy to focus the samples. The camera was set to its extended zoom, infinity-focused lens configuration and infinity manual focus setting. The combination was vignette-free. Photos are x60-x120. Free-downloads of PhotoFiltre and FastStone Image Viewer were used for editing and resizing.
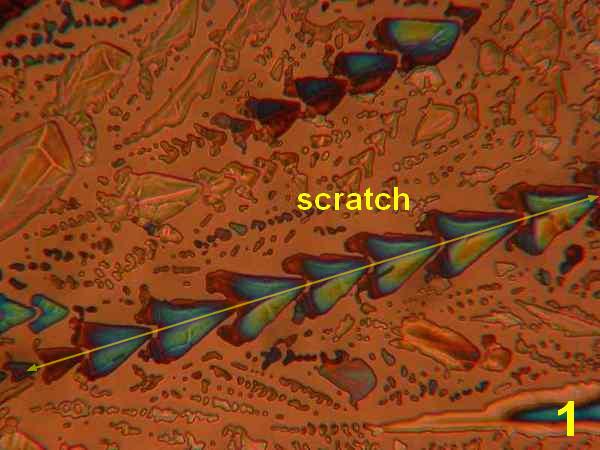
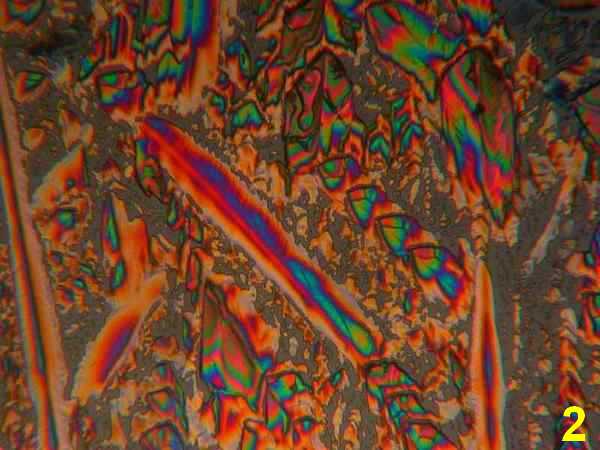
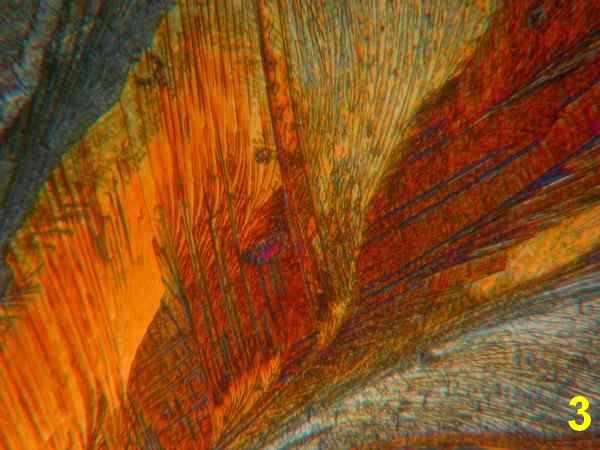
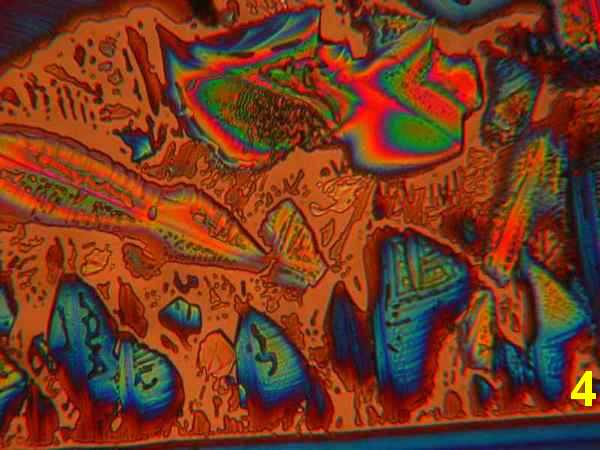
Photos 1-4 - 1,10-phenanthroline/ various acetone, ethanol, isopropanol, water
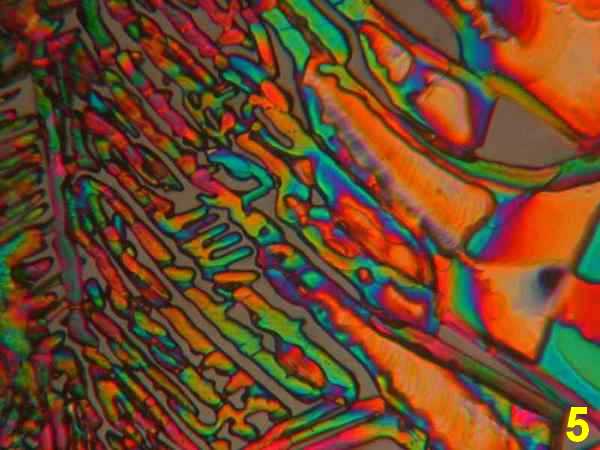
Photo 5 - thiourea/ ethanol, water
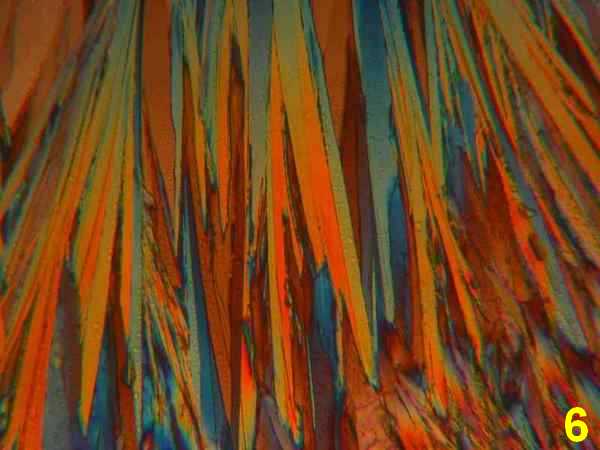
Photo 6 - 1,10-phenanthroline+thiourea/ ethanol, water
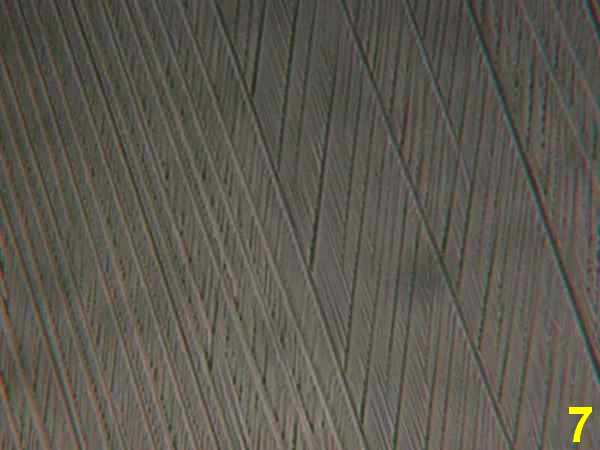
Photo 7 - THAM*/ acetone,water
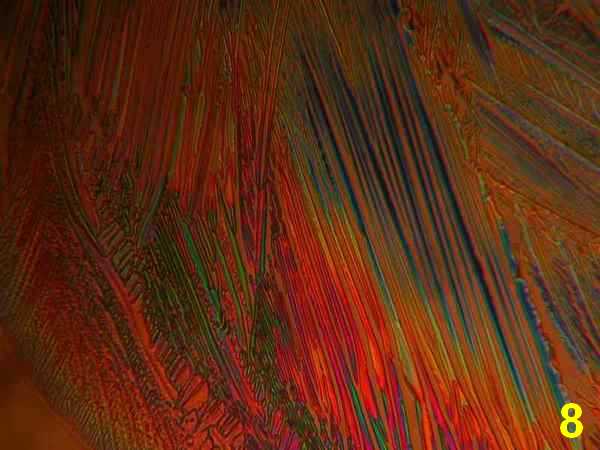
Photo 8 - 1,10-phenanthroline+THAM/ acetone,water
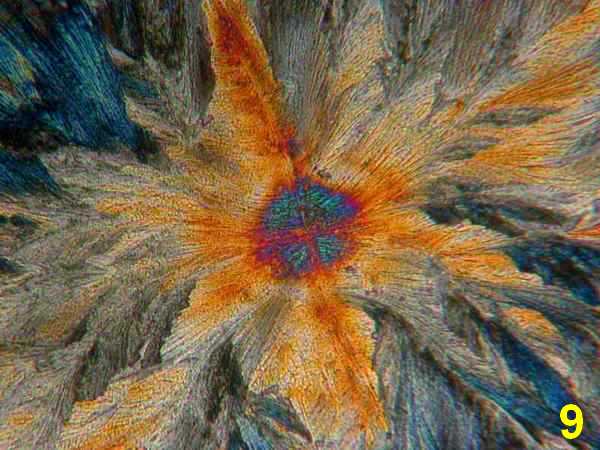
Photo 9 - 1,10-phenanthroline/ isopropanol+anhydrous HCl
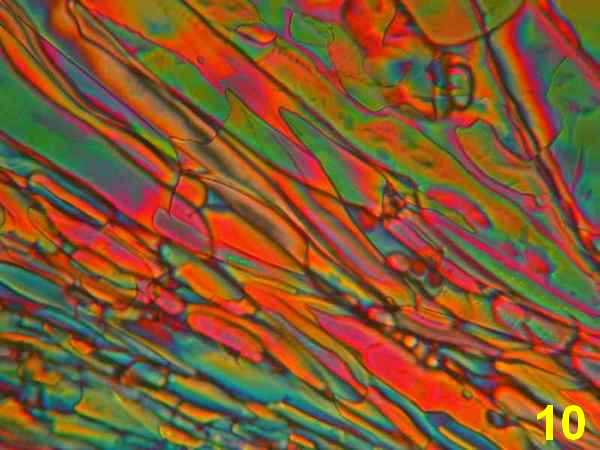
Photo 10 - 1,10-phenanthroline/ isopropanol+HSH *THAM = Tris(Hydroxymethyl)AminoMethane
Results: The first four photos (Photos 1-4) indicate that solvent systems and simple very shallow high-energy scratches change the basic phenanthroline monohydrate crystal morphology, as might be expected. Examples of the most typical patterns were selected for viewing. The next photographs (Photos 5-6) illustrate the effects of co-crystallization of phenanthroline monohydrate with thiourea [ (H2N)2CS) ] This provides a different crystallization matrix and/or hydrogen bonding possibilities. Thiourea is essentially a planar molecule that ordinarily exists as ribbon structures connected by hydrogen-bonded –NH2…S connections. It readily co-crystallizes forming inclusion compounds. Many polymorphs and phases are reported, some of them ferroelectric. 10 Photos 7-8 involve another co-crystallizion of phenanthroline and THAM [ (HOCH2)3CNH2 ]. THAM is an almost spherical molecule believed to consist of a chain rather than a layer structure. 11 Plastic and biaxial polymorphs are reported. THAM readily forms hydrogen-bonds with many organic/bio-organic molecules. The Newton color palette is now augmented by a generous geometric palette. In Photo 9 the crystallization involved phenanthroline in isopropanol with a low concentration of anhydrous hydrochloric acid. The spherulitic shape signals a difference introduced by the formation of a chloride salt. Photo 10 used isopropanol plus H2S, which will form a different hydrogen bonding with the phenanthroline. H2S is between water and hydrochloric acid in acidity. Painting with new chemical bonds certainly creates polymorphic structures.
The microscopist therefore has available an infinite set of painting and sketching tools. Choosing molecules for creating post-modern portraits can be rewarding. Most crystallographers publish their crystallographic data on the Internet in one of the half-dozen standard formats, and the free download “Mercury”1 can plot these for you. A friendly local lab can often provide the few milligrams of materials needed for “painting”. The rest lies in your imagination.
NB: H2S is easily produced from metal sulfides and acid, or from thioacetamide. It is a poisonous gas that rapidly desensitizes the odor receptors that warn us of its presence. It should be used with caution.
Acknowledgements: Figure 2 is adapted from K. Nassaua, and the M-L Chart is adapted from W. Nessec, (see below).
Further-reading, and Interactive simulations
a. The Physics and Chemistry of Color, K. Nassau, Wiley, 2001
b. Optical Mineralogy, D. Shelley, Elsevier, 1985
c. Introduction to Optical Mineralogy, W. Nesse, Oxford Univ. Press, 2004
d. http://micro.magnet.fsu.edu/primer birefringence, crystal orientation,
e. http://www.olympusmicro.com/primer birefringence, polarized light
f. http://www.rpi.edu/dept/phys/Dept2/APPhys1/optics/optics/node7.html refractive index
g. http://www.enzim.hu/~szia/emanim superb interactive birefringence Python/VPython suite
1 The crystal unit cell diagrams are derived from published *.cif data using the free download "Mercury" from Cambridge Crystallographic Systems.; Y. Tian, Acta Cryst. (1995). C51, 2309-2312
2 OPTIONAL!: All You Never Wanted to Know; and Were Courageous Enough Not to Ask:
Interfering Puzzles: In crossed-polarizer transmission birefringence, when the retardation is nλ , the orthogonal beam-pair vectors are in opposite directions and they cancel in addition. If the retardation is nλ/2 , the vectors are in the same direction, and they constructively add. At retardations of (nλ/2 )+ λ/4 the combination produces circularly polarized light. In general, as d or (no- ne) increase, the emerging light ray vector-pairs combine successively with variable values in various directions perpendicular to the travel direction, a phenomenon called elliptical polarization. In contrast, reflection waves from tapered oil or soap-bubble films, where the beams are vibrating in the same plane, in-phase vibrations constructively interfere, and out-of-phase vibrations destructively interfere. A pleasant way to examine these statements is a free download called “Emanim”.g It is an interactive suite that is a pleasure to behold.
Shapes of Light: The intensity interference pattern for a combined pair of monochromatic birefringent light beams plotted as a function of retardation is not a simple sinusoid, but a sin2(…) function.3
Indices of Refraction: Uniaxial crystals involve two RIs. Biaxial crystals involve three RIs.
Pause for Reflections: The development of the color sequence derived from Newton’s original experiments, and presented in the Michel-Levy Birefringence Chart, may be modified when reflection of unpolarized light occurs at two (or more) nearly parallel surfaces. If there is a reflection at an interface where n1<n2, there is an added phase shift of λ/2, where lambda is the wave-length. If n1>n2 there is no phase shift upon reflection. In the first, and usual case, the Newton sequence is seen. In a three layer system where two λ/2 phase shifts occur, (n1<n2<n3) the RGB curves begin at "White" and a complementary color sequence is seen.
Alternating notations: Notations change with time, author and discipline. “e”, “o” - “nf”, “ns” - and “ε”, “ω”, are often interchanged. A cross-referencing table of differing symbols is in (b) above.
Other Literature References:
3 Cf. ref. 2 (Shapes of Light) above, A. Johannsen, Manual of Petrographic Methods, McGraw-Hill, 1918
Cf. O. Heavens, R. Ditchburn, Insight into Optics, Wiley, 1991; p 88.
(there are typographical errors in Nesse’s equations, p40. above.
4 A. Gavezzottia and G. Filippinib Chem. Commun., 1998, 287
5 J. Bernstein J. Phys. D Appl. Phys. 26 (1993), 666
6 R. Hilfiker ed., Polymorphism in the Pharmaceutical Industry, Wiley-VCH 2006
7 Daniel Winn, PhD Dissertation, Univ. of Massachusetts, 1999
A. I. Belov and L. I. lsaenko, J. Phys. D Appl. Phys. 26 (1993) 823
8 F. P. A. Fabbiani, et. al., Cryst. Eng. Comm, 2007, 9, 728
9 A. Nangia and G. R. Desiraju Chem. Commun., 1999, 605
10 S. Swamintahan, Acta Crystall. 1984 B40 300; A. Masunov J. Phys. Chem. B 104 (4) 806 2000
11 I. Kanesaka Journal of Raman Spectroscopy, 29, #9, 813 1998; R. Rudman, Science 200, 531 1978
Comments to the author Ray Dessy are welcomed.
Published in the November 2008 edition of Micscape.
Please report any Web problems or offer general comments to the Micscape Editor .
Micscape is the on-line monthly magazine of the Microscopy UK web site at Microscopy-UK
© Onview.net Ltd, Microscopy-UK, and all contributors 1995
onwards. All rights reserved.
Main site is at
www.microscopy-uk.org.uk
with full
mirror at
www.microscopy-uk.net
.